
The question we’re going to be looking at today is inspired by our course, Server-side Tagging In Google Tag Manager.
How do I proactively monitor my server-side tagging setup so that I’m alerted in chase there are uptime issues?
One of the things that might surprise server-side tagging users is how much cloud engineering is involved in maintaining the infrastructure for the tagging endpoint.
If your setup is fairly standard and you don’t expect to get rattled with huge traffic fluctuations, you might get off pretty easily. At that point, it’s almost a set-and-forget setup, although you will still need to do your due diligence with billing alerts, DNS changes, and configuring additional headers, for example.
However, if there’s even the slightest risk that traffic could push your infrastructure to its limits, you will need to set up some monitoring and alerting processes.
This article walks you through a few examples of what type of autonomous monitoring you could establish for your server-side tagging endpoint. If you have additional ideas, please share them in the comments!
Video walkthrough
If you prefer this walkthrough in video format, you can check out the video below.
Don’t forget to subscribe to the Simmer YouTube channel for more content like this.
What does monitoring mean?
In the context of this article, monitoring quite literally means using the Cloud Monitoring suite of tools.
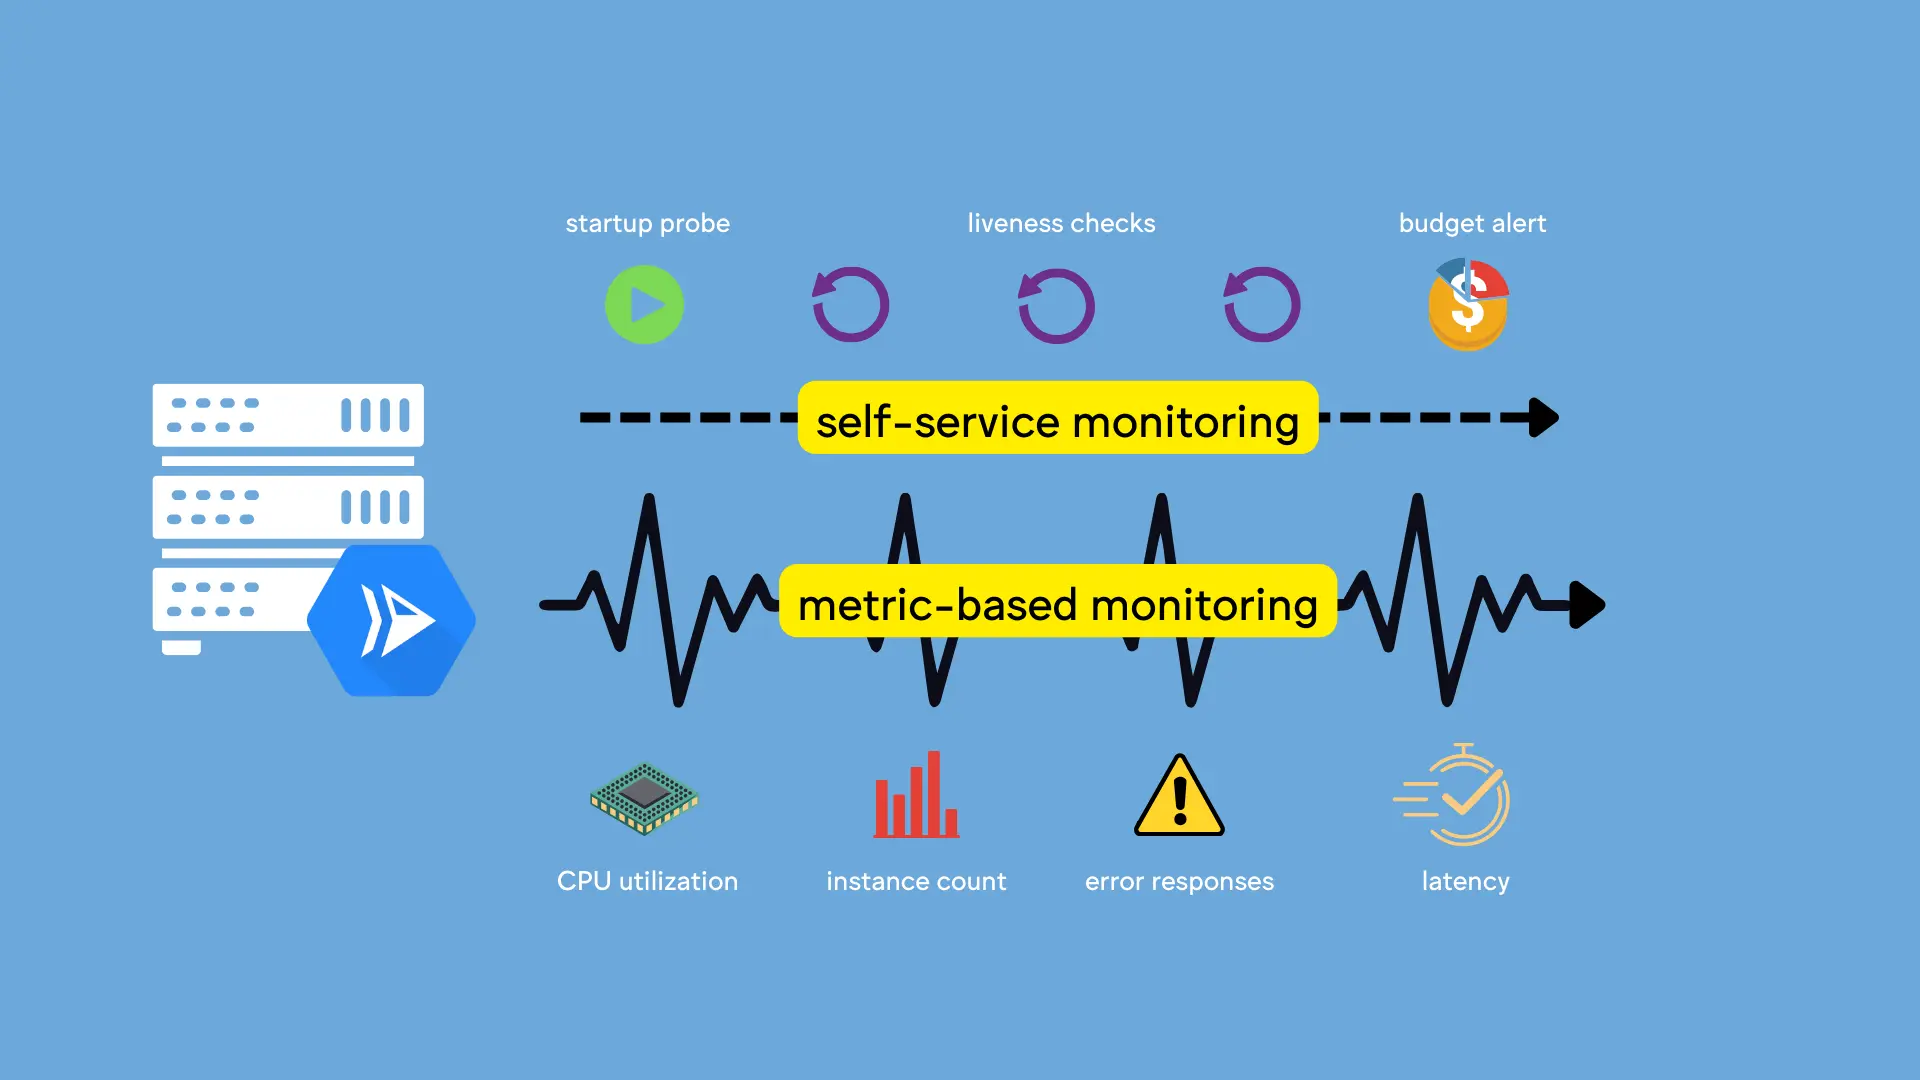
We’ll also dip into health checks and billing alerts to make sure we bookend the alert setup with both self-service probes as well as a warning in case we’re approaching budget limits.
But the focus will be on setting up alerting policies based on some default metrics (like container utilization and instance counts) as well as custom, log-based metrics (such as the count of HTTP errors for requests that should not produce them).
Importantly, the tips in this article (and the video) are just general guidelines for what types of alerts you could create. There are lots of metrics to choose from, lots of different log messages to parse, and lots of approaches you can take, depending on what your organization is interested in.
Remember also that you need to tweak the thresholds to make the metrics meaningful. The thresholds I use in this article are what works for my particular setup, but if your infrastructure faces a lot of fluctuating traffic then you might need to make the thresholds even more sensitive.
Health checks
We’ll start with health checks.
Health checks mean that the Google Cloud infrastructure itself checks if the Cloud Run service is “healthy”. Healthiness means that the service responds to requests in a timely manner.
If the service is ever “unhealthy”, it usually means that it gets restarted.
This is actually an important part of server-side Google Tag Manager upkeep, because whenever the service is (re)started, it fetches the latest application runtime from Google’s servers.
Health checks are service-specific, so if you’re running a multi-service setup (for example with a global load balancer), you’ll need to add the health checks to all of the Cloud Run services you want to monitor.
In the video I state that I rarely add health checks to the Preview service, because it’s unlikely it will ever be overwhelmed with traffic.
The health checks we’ll configure are:
- Startup probe, which runs after the service has initially started up. Its job is to make sure the service is up and running. If the startup probe returns an unhealthy response, the service is shut down and restarted.
- Liveness probe, which checks periodically if the service is up and running. If the liveness probe returns an unhealthy response, the service is shut down and restarted.
Go to the Cloud Run dashboard to see a list of all your Cloud Run services.
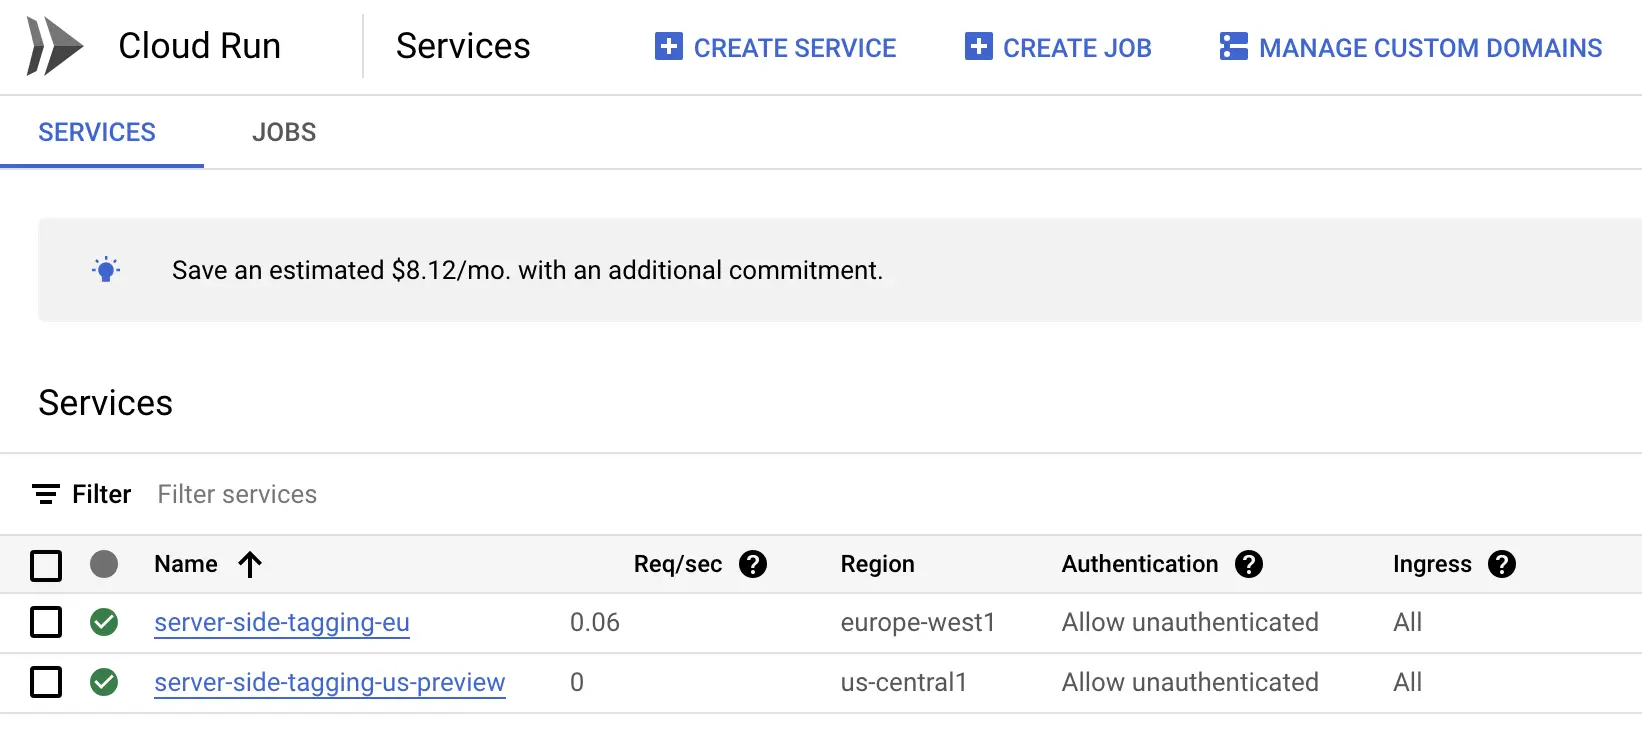
Here, repeat the following steps for all of the services to which you want to add health checks.
1. Click the name of the service you want to edit
This will open the dashboard for the service.
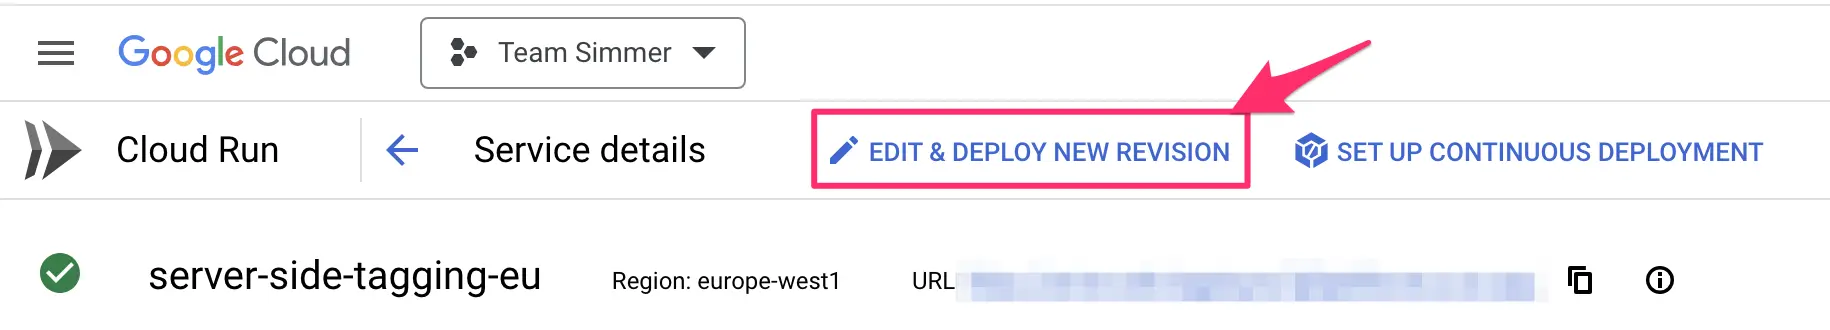
2. In the top of the dashboard, click “EDIT & DEPLOY NEW REVISION”
3. Scroll down to “Health checks”
This is what the final state should look like for server-side Google Tag Manager:
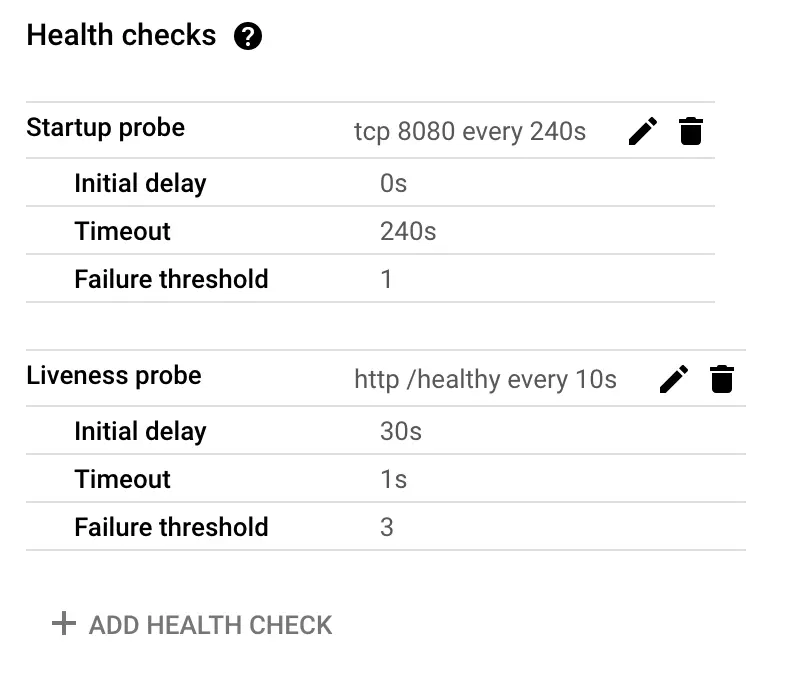
If you’re missing either the Startup probe or the Liveness probe, click “+ ADD HEALTH CHECK” to create them.
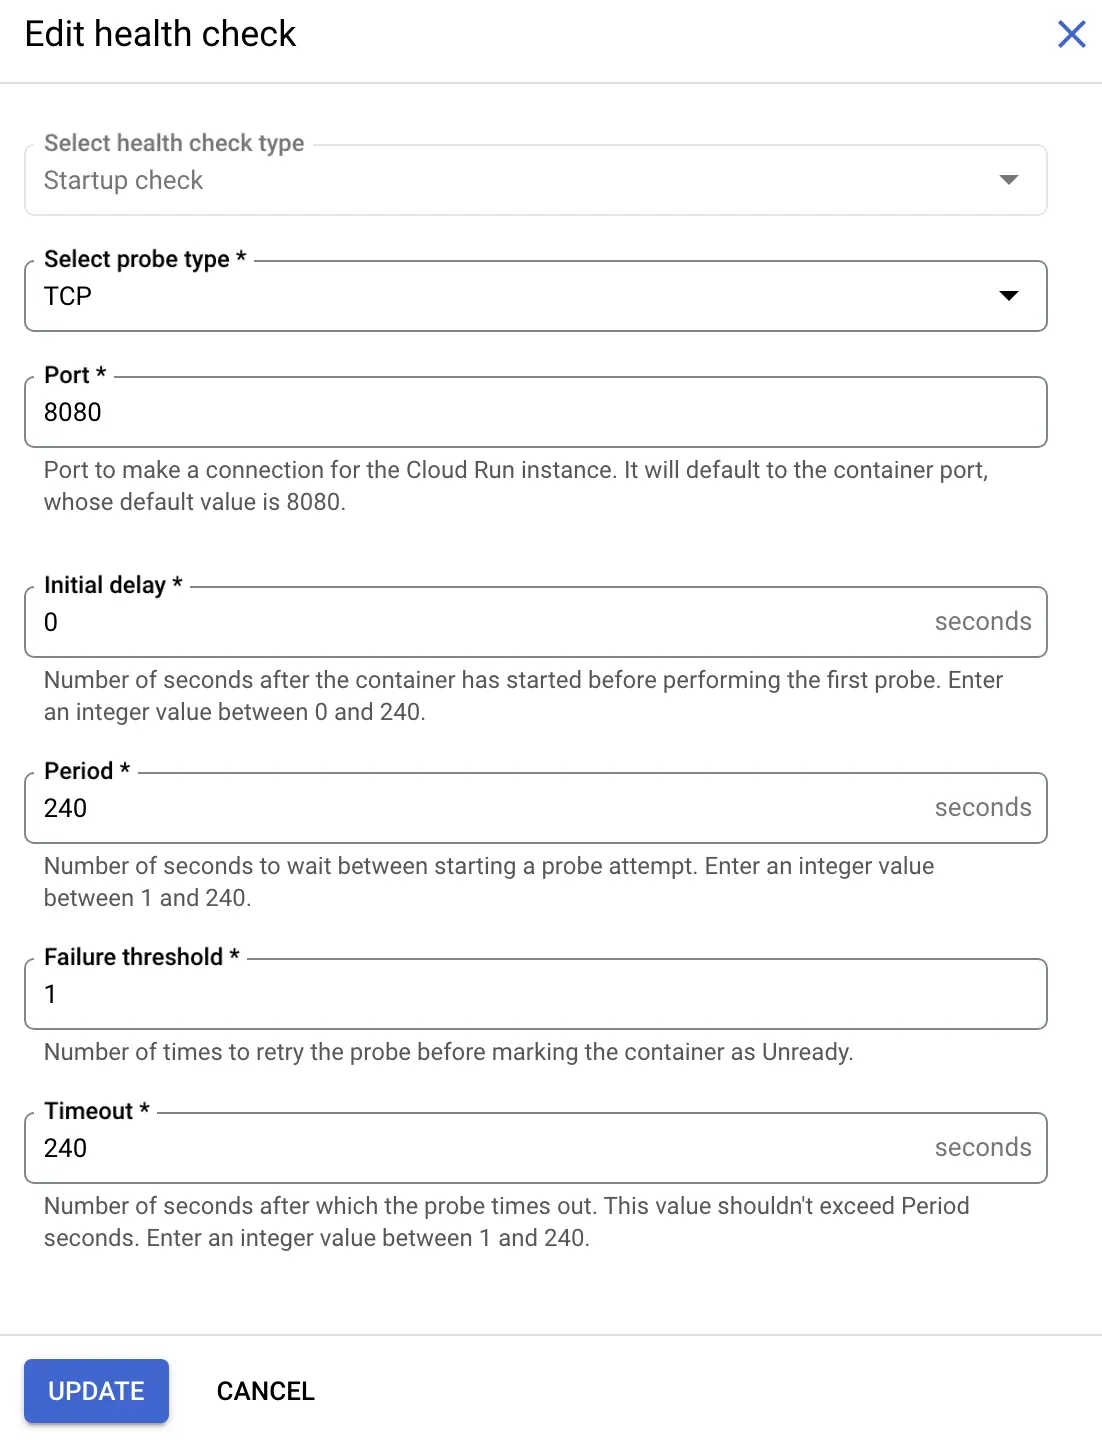
4. Startup probe settings
Here are the settings for the Startup probe:
- Select probe type: TCP
- Port: 8080
- Initial delay: 0
- Period: 240
- Failure threshold: 1
- Timeout: 240
Click UPDATE or CREATE when ready.
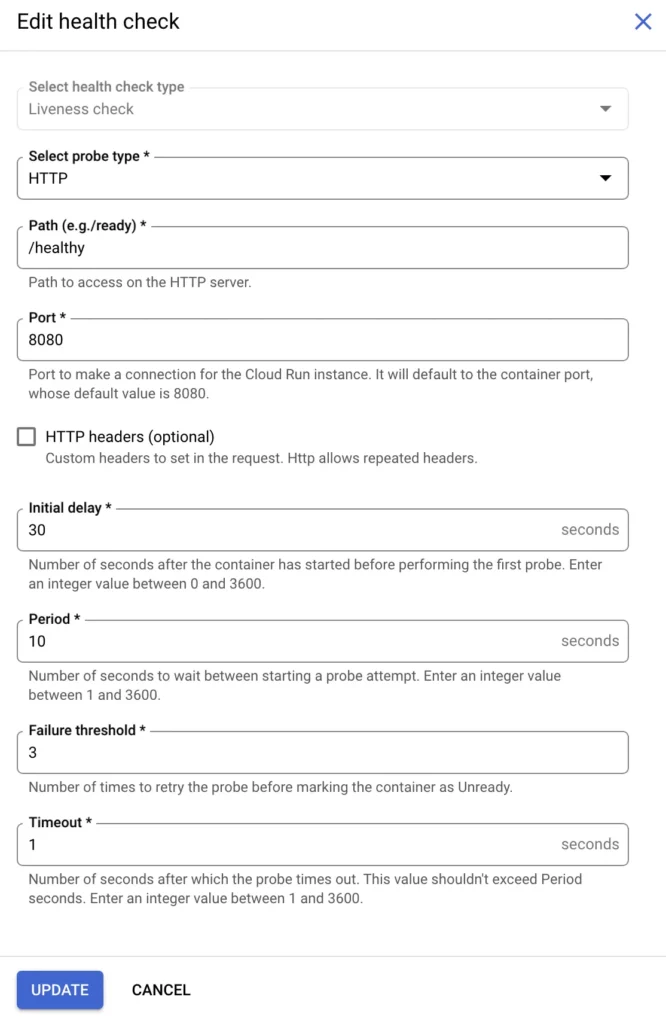
5. Liveness probe settings
Here are the settings for the Liveness probe:
- Select probe type: HTTP
- Path:
/healthy - Port: 8080
- Initial delay: 30
- Period: 10
- Failure threshold: 3
- Timeout: 1
Click UPDATE or CREATE when ready.
6. Deploy
Once you’re done configuring the probes, scroll down and click DEPLOY to deploy the revision.
Congratulations, you’ve now set up health checks for your Cloud Run service. Remember to repeat these steps for all the services you want to include in these uptime checks.

Billing and budget alerts
Note! To edit Billing settings, you need access to the Billing Account.
Another precaution you’ll want to take is to configure your Billing Account to warn you in case you are approaching a predetermined budget.
For example, once you know the typical spend for your Cloud Run infrastructure, it’s a good idea to set up a budget that’s higher than this spend and represents the maximum what you’re willing to pay for the setup any given month.
Note that setting up a budget doesn’t automatically cut spending once the budget is reached. The budget is meant for alerting only.
You can set up budgets by going to the Billing / Budgets dashboard.
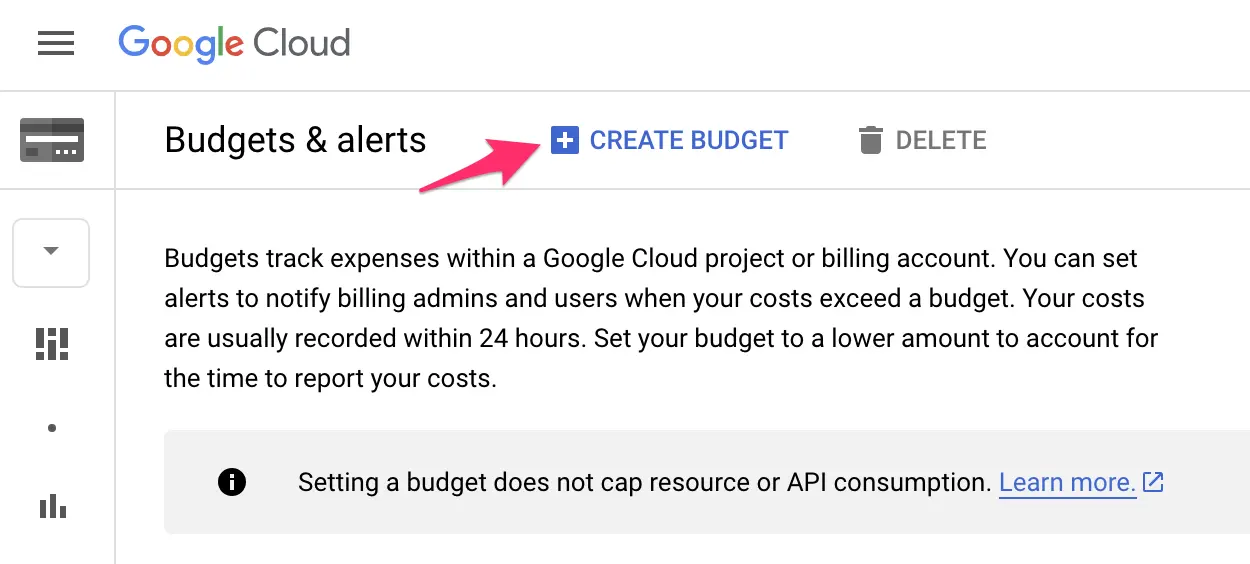
Here, click CREATE BUDGET to create a new budget.
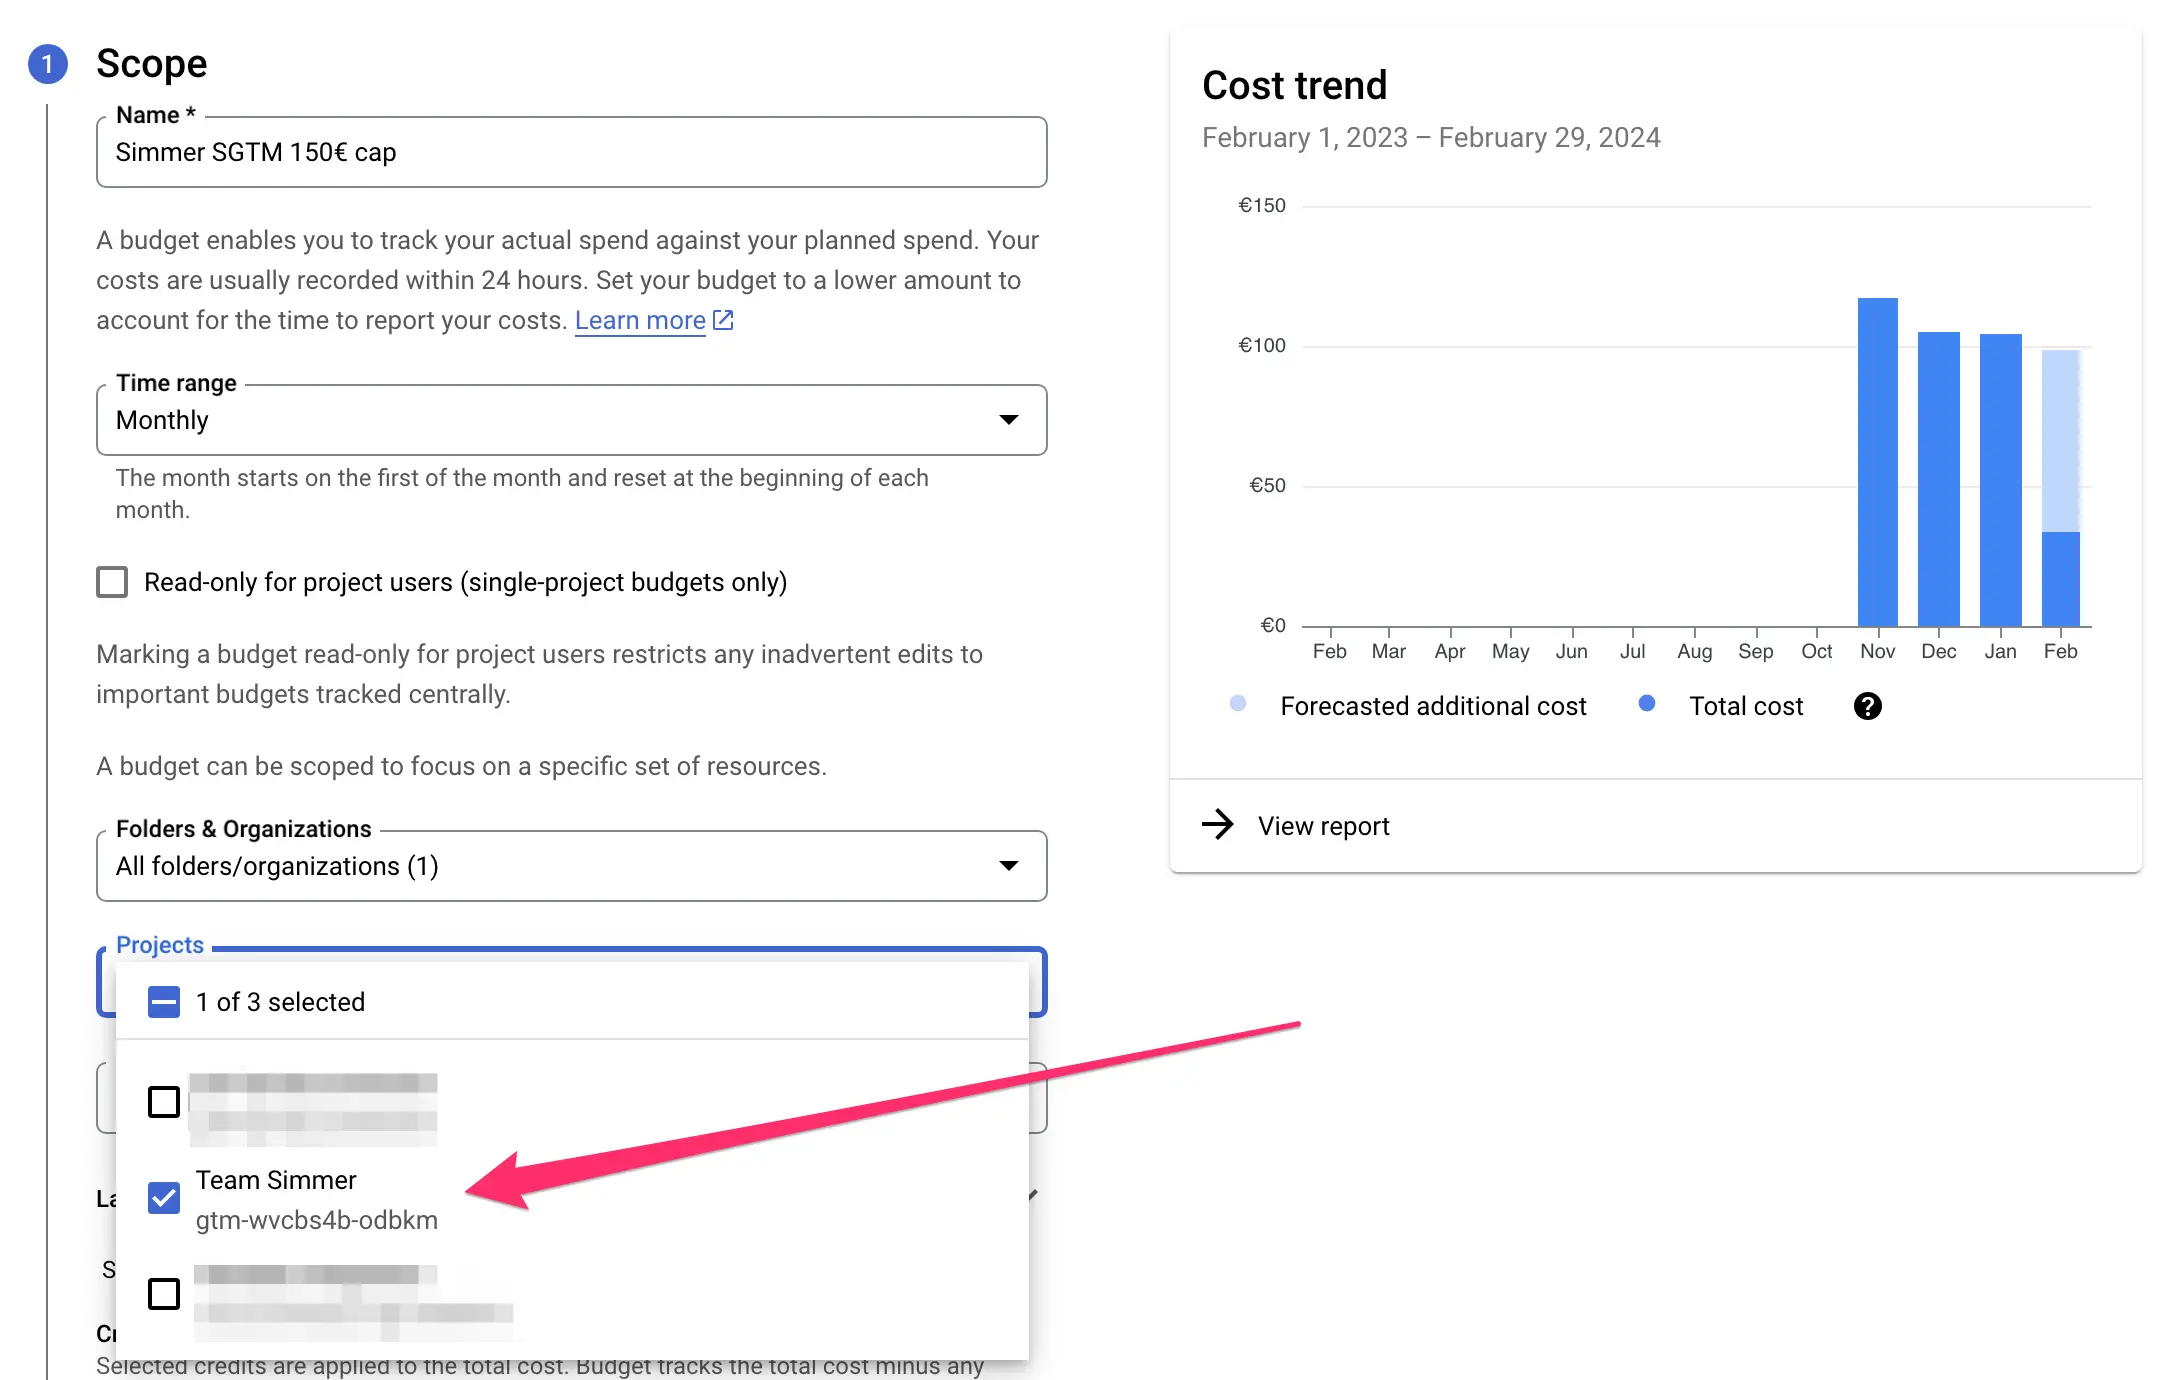
Budget settings
Give the budget a name. Then, my approach is to set project-specific budgets. So instead of monitoring all of the spend on the Billing Account, I’ll focus on just the project I’m in charge of.
If you want to do the same, you can expand the project filter to just choose the project with the Cloud Run service. This will update the graph as well to show only that project’s spend.
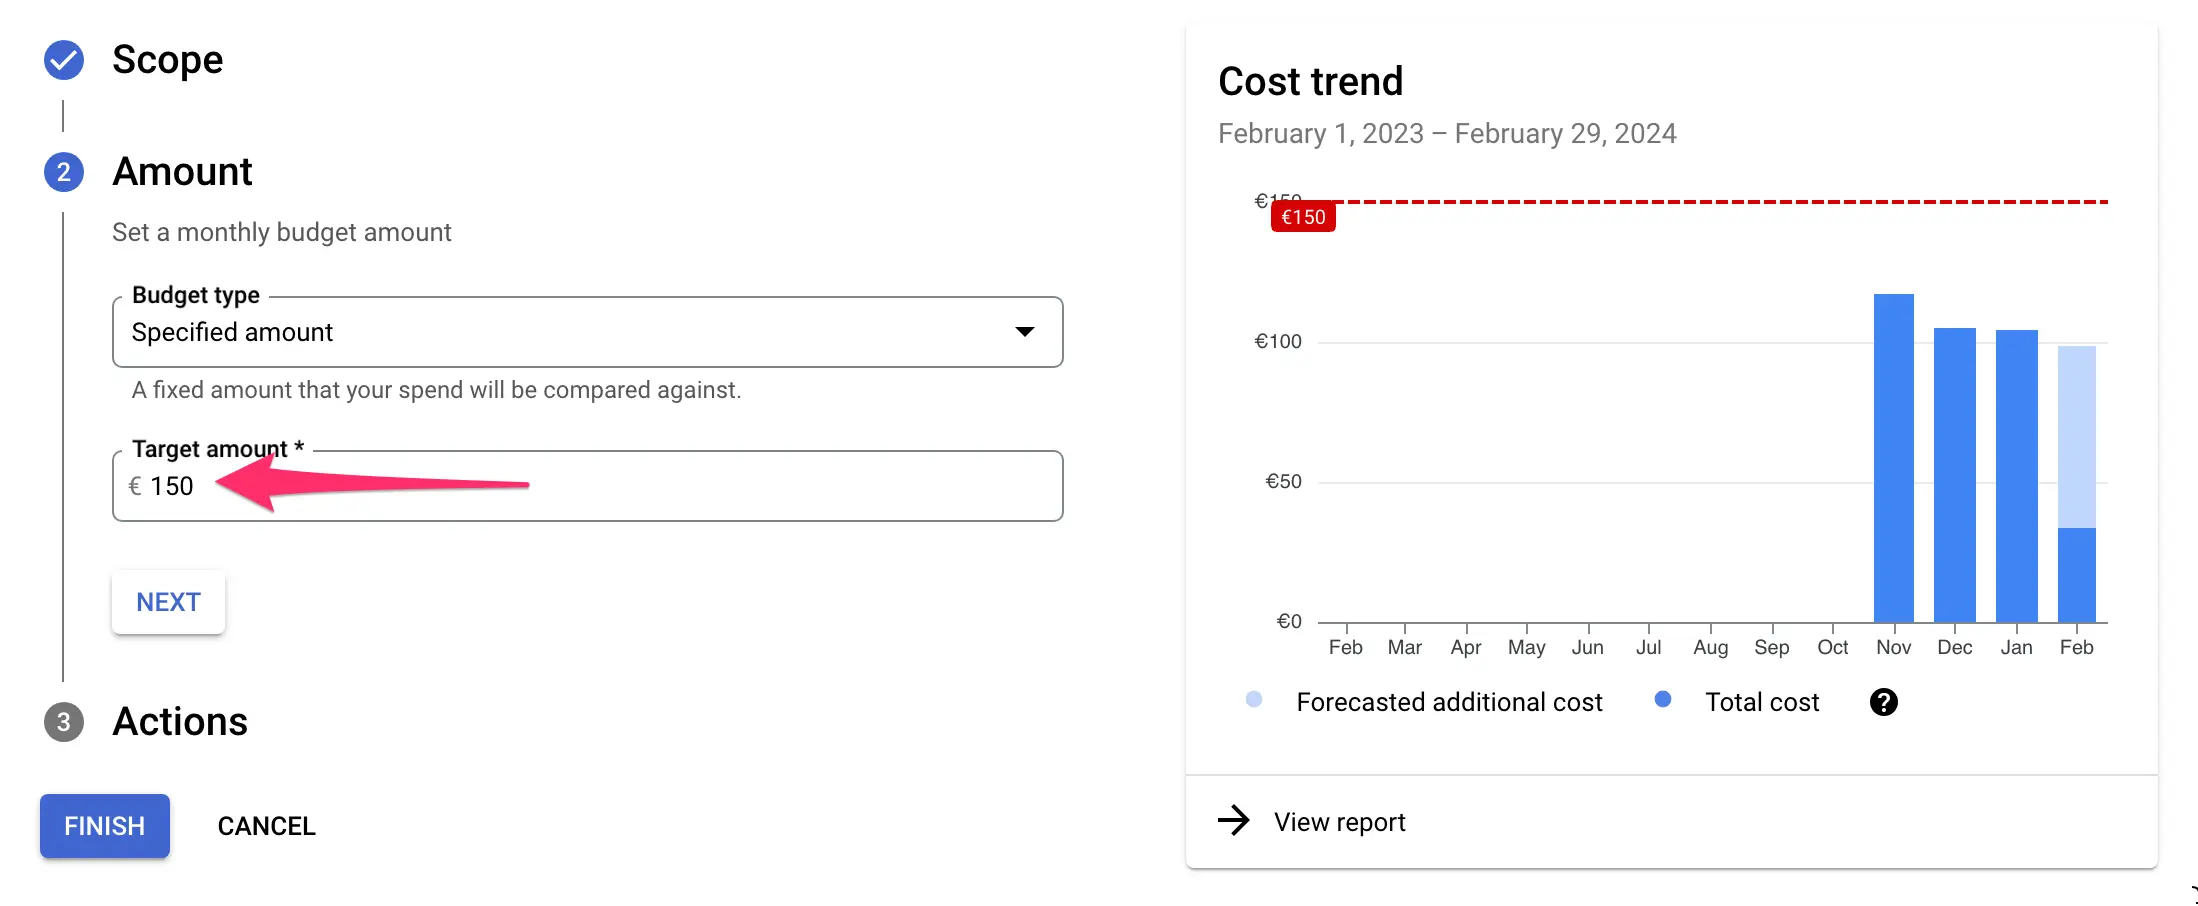
Configure the budget amount
Next, under Amount, you get to configure what the budget should actually be.
In my example, I have a spend of roughly 110 euros per month for this project. To have a decent buffer, I’ll set the budget at 150 euros.
Set up the alert actions
Finally, you can configure the thresholds at which you’ll be notified when the budget is being consumed.
By default, you’ll receive warnings at 50%, 90%, and 100% of the spend for the actual, observed spend. Feel free to change these thresholds to your liking, and you can also switch from triggering on the Actual spend to instead triggering on Forecasted spend, in case you want to be alerted in advance.
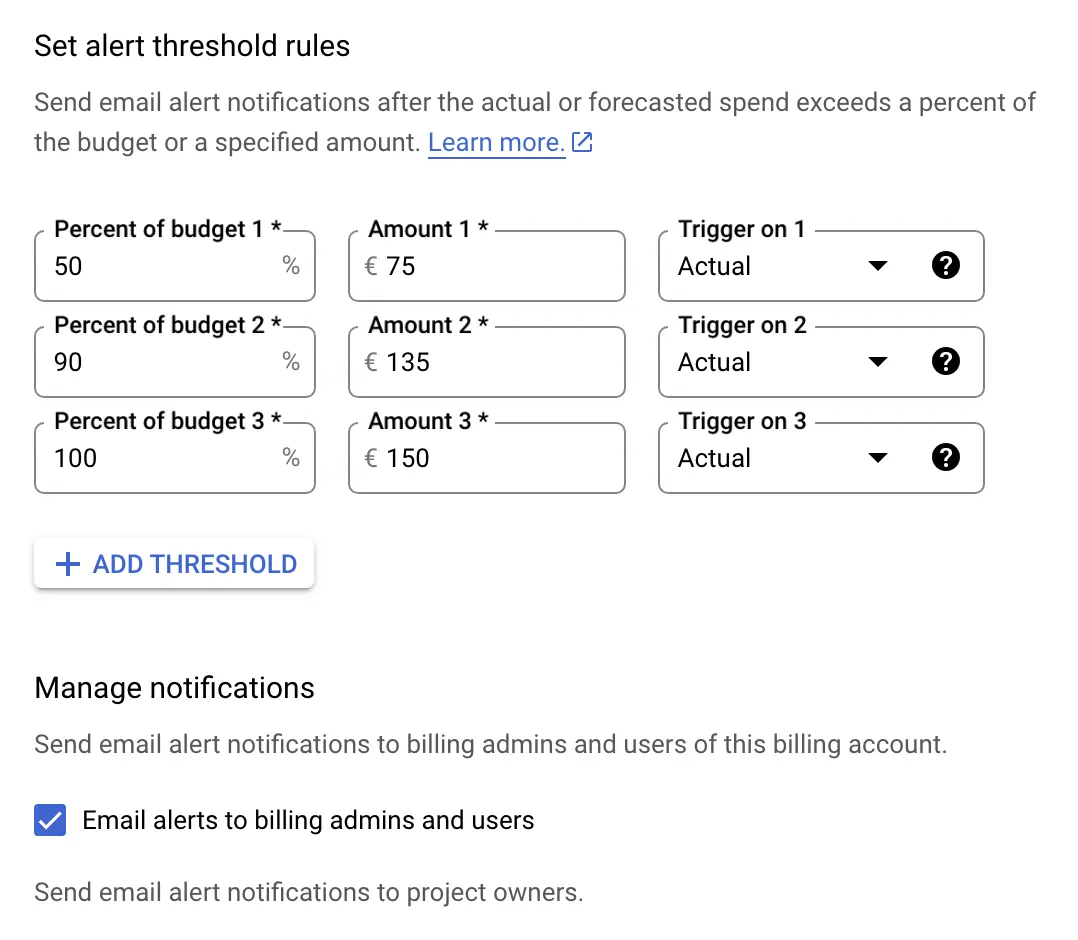
Once you’ve configured the budget and the alerts, click FINISH to save.
Cloud Monitoring
Now that we have our health checks and billing alerts set, it’s time to move to custom alerts with Cloud Monitoring.
In Cloud Monitoring, you can set up alert policies whenever the monitored metrics reach a certain level over a period of time.
In the last part of this article, we’ll set up four useful metrics in Cloud Monitoring. There are lots of metrics to choose from, so let me know in the comments in case you’ve found other metrics that can be useful, too!
Alert 1: Count of error logs
First, we’ll create a log-based metric. This will measure error responses (HTTP status 4XX or 5XX) to known request paths.
Since my setup is a fairly run-of-the-mill Google setup, I’m mainly sending these requests to the server container:
/gtm.jsfor the Google Tag Manager web container/gtag/for the Google Tag container/g/collectfor Google Analytics 4 requests
If you’re using the Stape Data Tag or some other ingestion method, you’ll need to update the paths in the log query to match the ones you want to monitor for errors.
Run the query
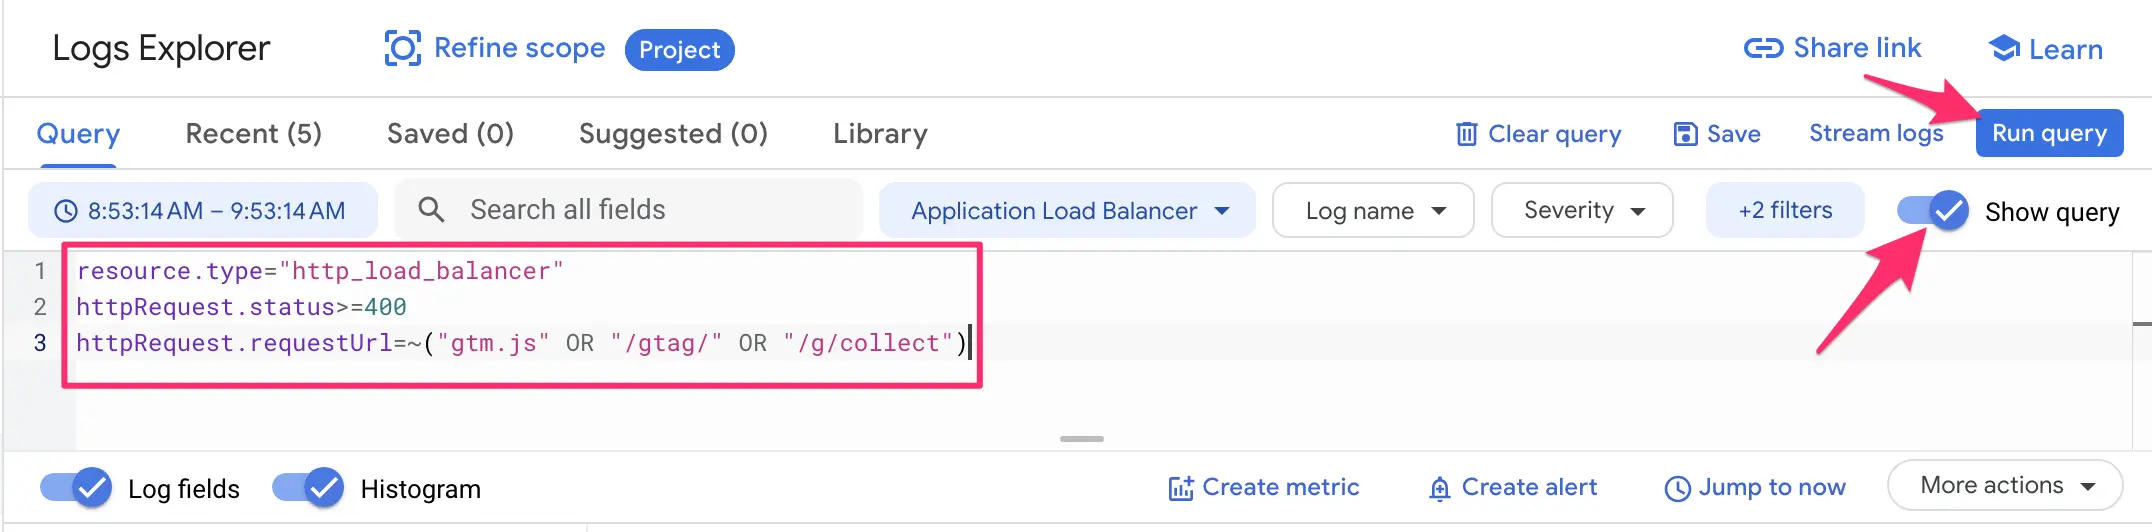
To create the metric, head over to the Logs Explorer, and enter the following query:
resource.type="http_load_balancer"
httpRequest.status>=400
httpRequest.requestUrl=~("gtm.js" OR "/gtag/" OR "/g/collect")
Note! The assumption here is that you have a load balancer in front of your SGTM setup. If you do not have a load balancer, you can change the first line to resource.type="cloud_run_revision".
Click Run Query.
Now, it’s possible you don’t see any entries – good for you! You can always extend the time for the query by clicking the time selector just above the query editor.
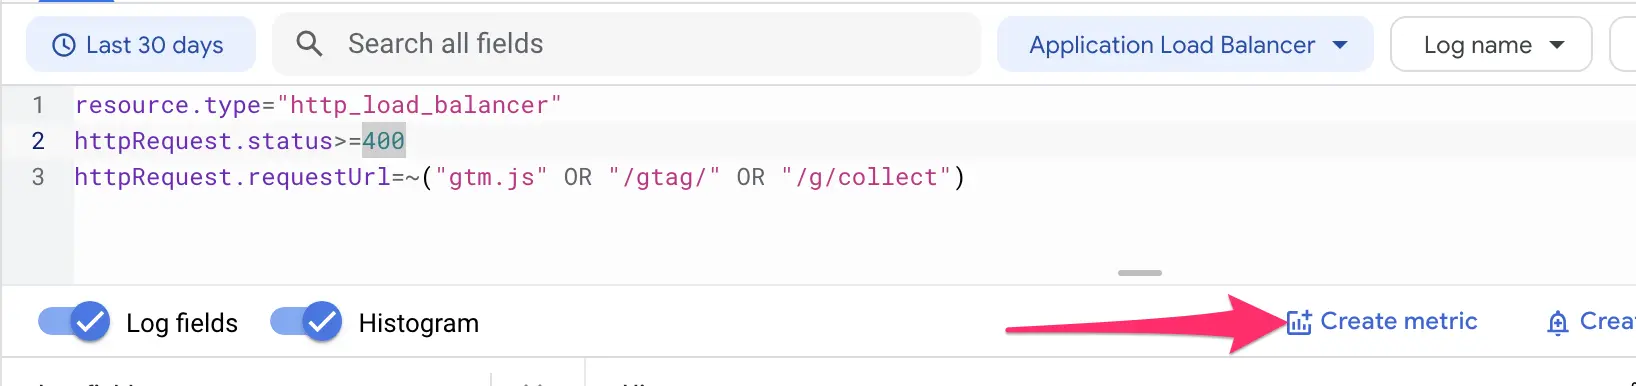
Create the metric
Next, we need to create a metric out of the query results. Click the Create metric button just below the query editor.
In the overlay, configure the metric as follows:
- Metric type: Counter
- Log-based metric name:
google_path_error_status(or whatever best describes the metric)
You should see the query you just ran automatically included in the metric settings. Click CREATE METRIC when ready.
Create the alerting policy
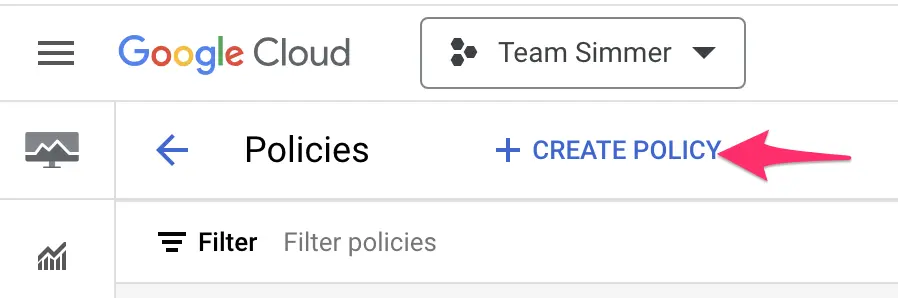
Once ready, head over to Monitoring / Policies and click to create a policy.
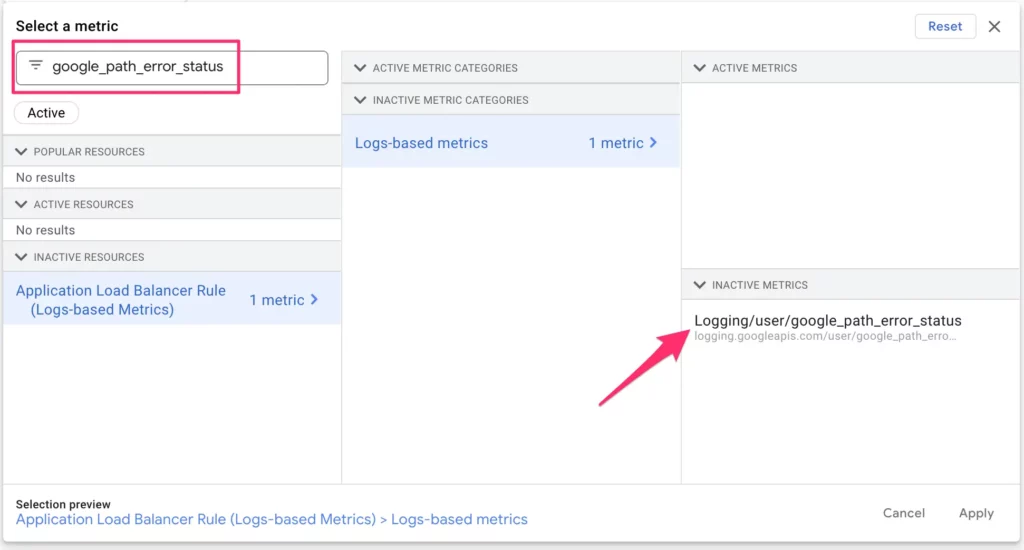
In the builder, click Select a metric, uncheck the Active filter, and search for the metric you just created using its name. Choose the metric and click Apply.
The “Active” status just means the metric has written time-series data over the past 24 hours. If the metric is brand new, it is very likely to not have the Active status yet.
Choose the rolling time window and function
We’re going to keep the default time window options here. The policy will be looking at a rolling time window of 5 minutes. This means that for the alert to trigger, the metric needs to stay above the threshold (see next step) for five consecutive minutes.
We’re also going to keep rate as the function. Rate measures the average count of requests per second over the time window. So if there’s a rate of 0.3/s, for example, it means that the average rate over the rolling time window has been 0.3 requests per second.
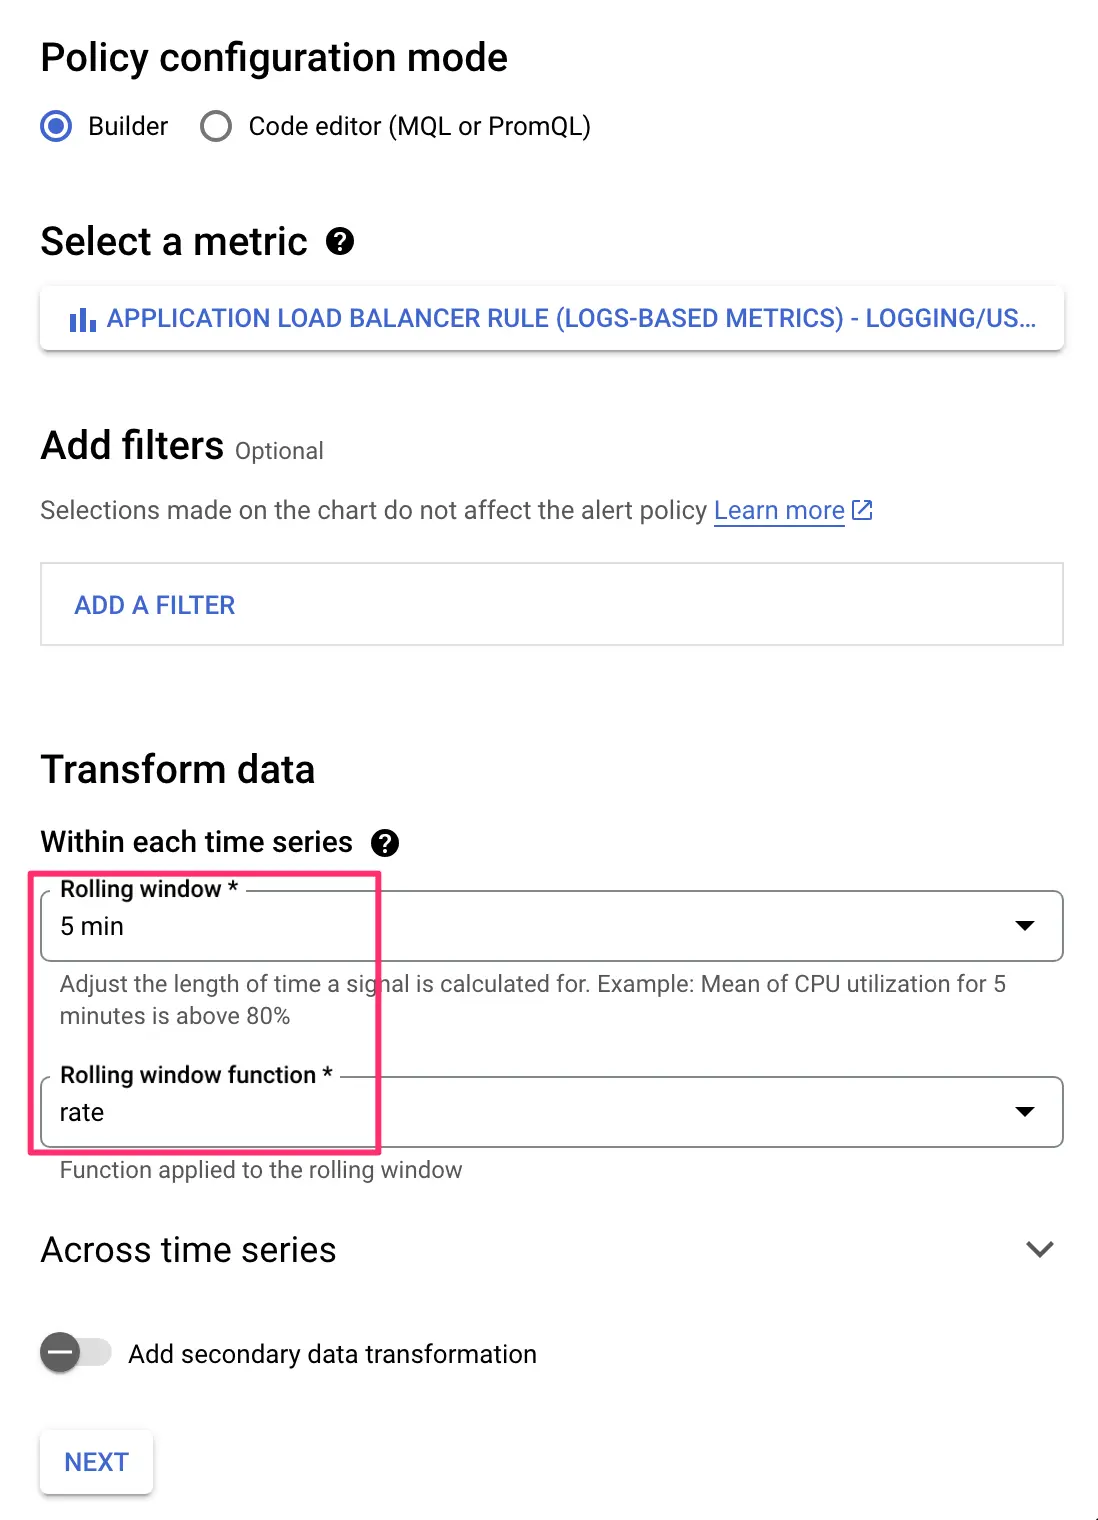
Click NEXT to proceed to configure the trigger.
Configure the trigger
You need to choose a threshold for the alert.
In my example, I’m using 5/s as the rate threshold before I get alerted. This means that for the alert to be dispatched, the paths I listed in the log query need to produce an error HTTP response at a rate of 5 requests per second on average over a rolling time window of 5 minutes.
This is quite a huge rate on a low-traffic site like ours. You might want to adjust this down if you have low traffic. You can always increase the threshold if necessary.
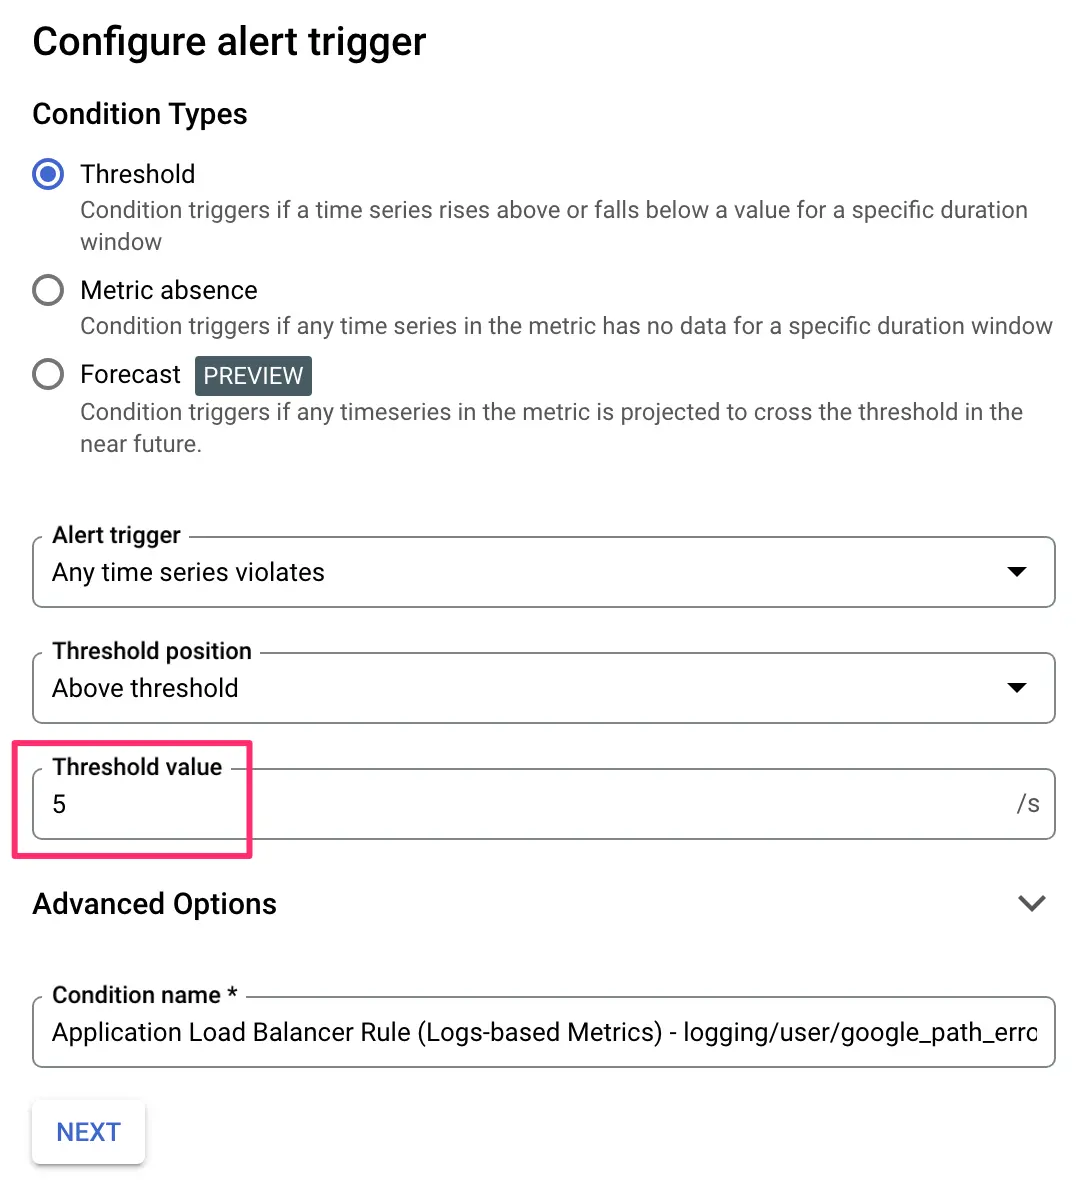
Once ready, click NEXT.
Notification settings
Finally, you need to choose how to be notified about the alert.
Click the list of Notification Channels to see the available channels. If there are none, you can click MANAGE NOTIFICATION CHANNELS to add additional channels.
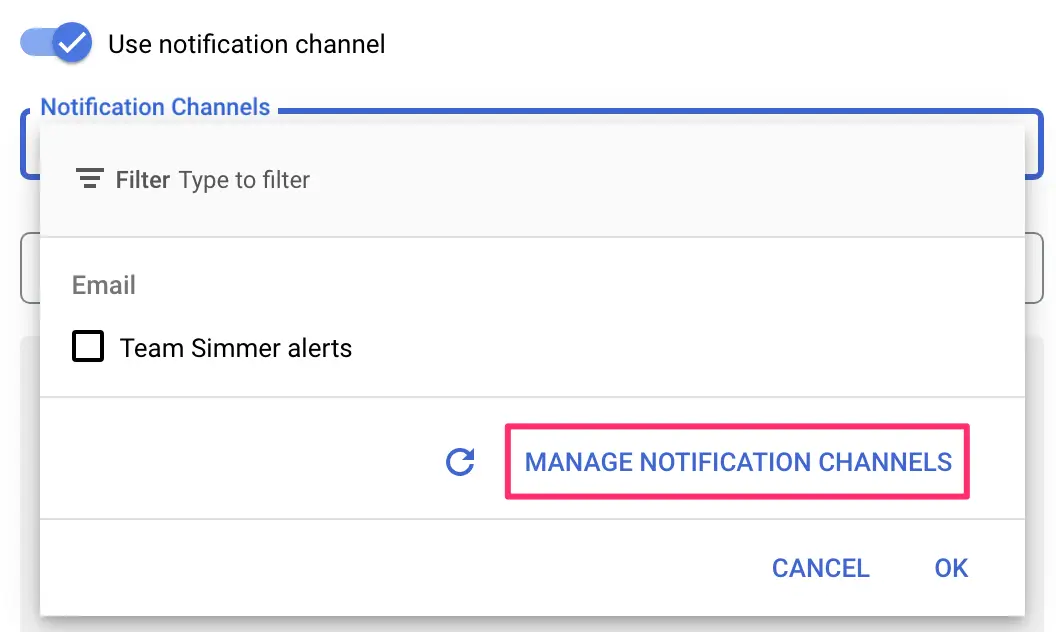
In the overlay, you can add additional notification channels to the list. There are lots to choose from, but Email is usually a solid choice. Once you’ve added the channels, you can close the overlay and refresh the list of available notification channels in the alert configuration.
I’ve chosen my team email address as the notification channel, and I’ve added a subject line that should let me know what the problem is at a glance.
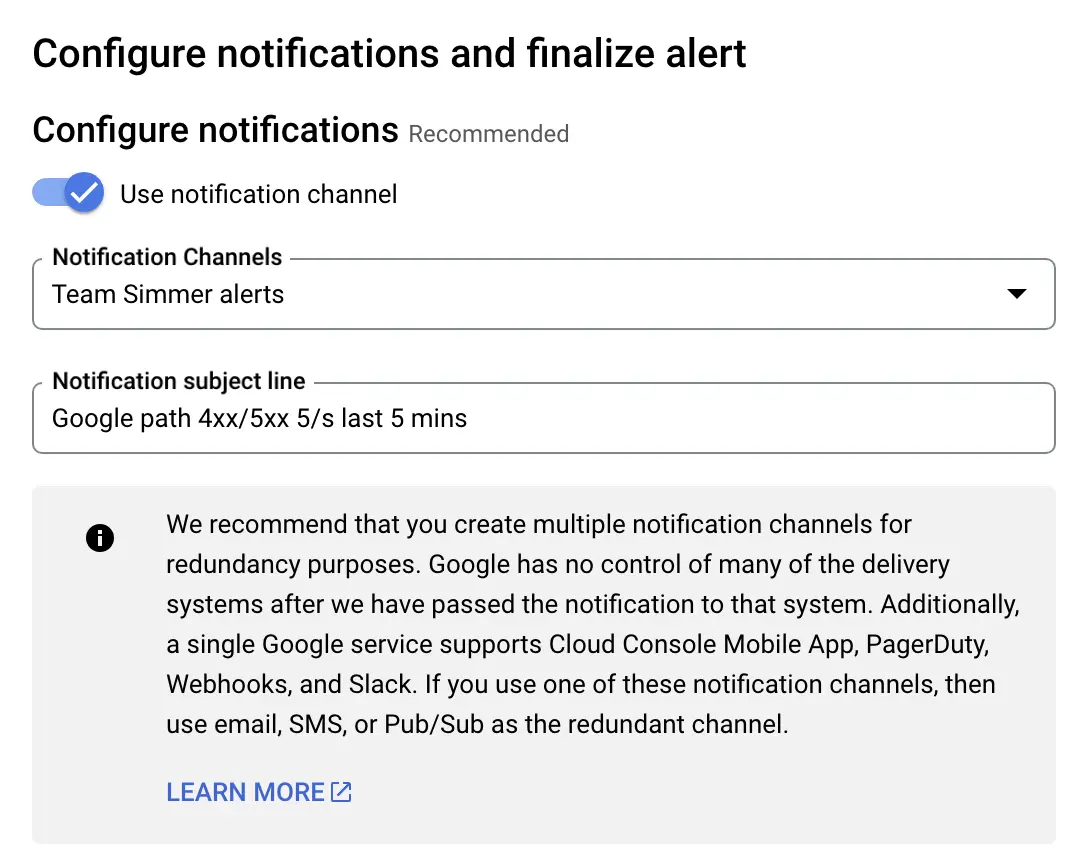
Scroll all the way down and give the alerting policy a descriptive name.
Once you’ve configured everything, click SAVE POLICY to save the alert.
Nice work – you’ve created the first alerting policy! You will get an email whenever your logs register HTTP error status codes at a rate of 5/s over a window of 5 minutes. These status codes are only monitored for specific paths that are important to your server-side tagging setup.
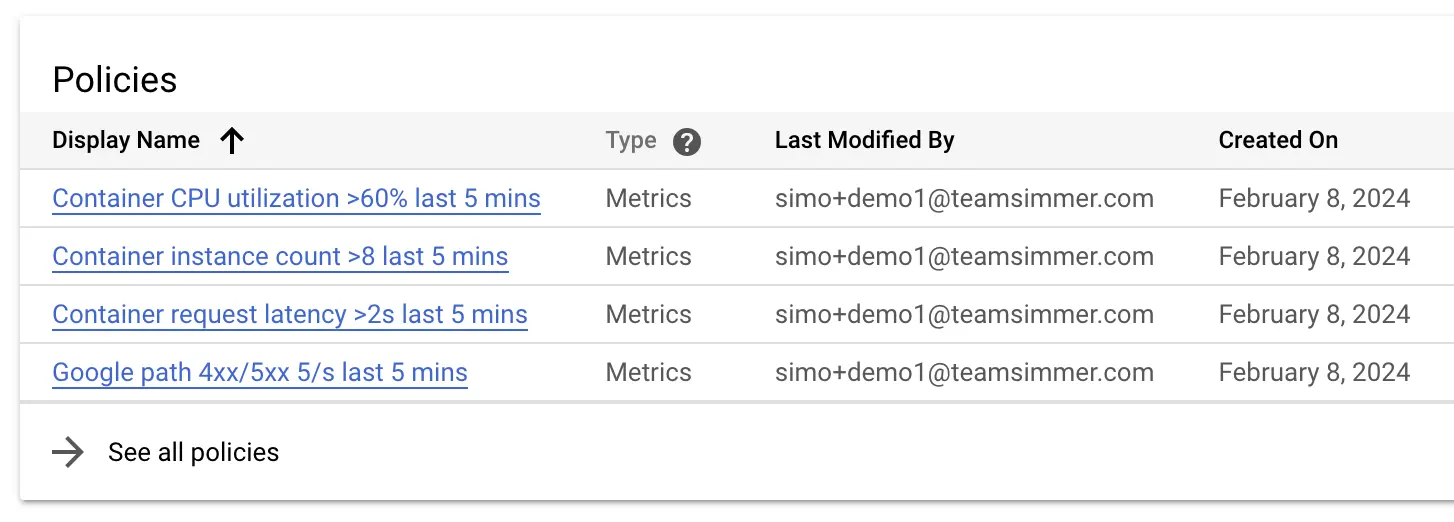
Now that you’ve walked through the steps of creating an alerting policy, we can create three additional policies quite quickly.
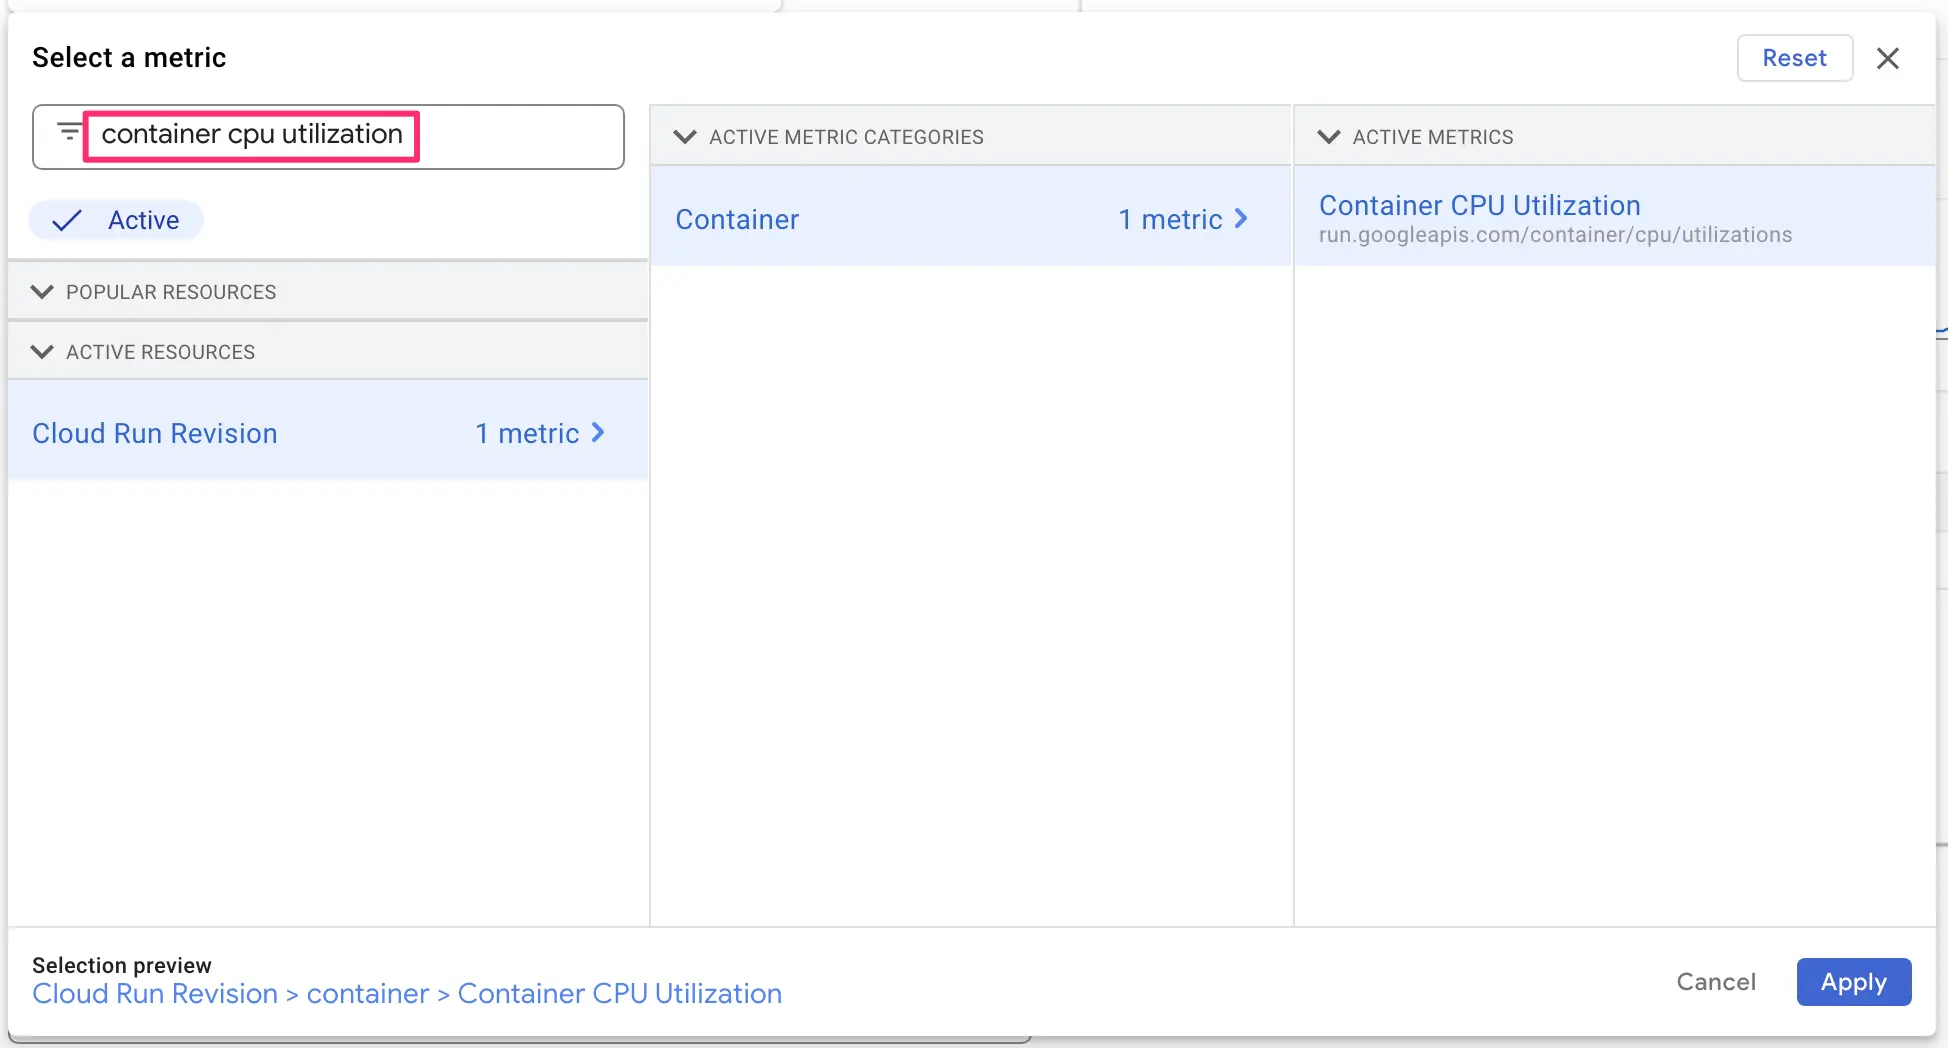
Alert 2: Container CPU utilization
The next metric we’ll focus on is container CPU utilization. The auto-scaling feature of Cloud Run tries to keep the CPU utilization across your Cloud Run service at an upper limit of 60%. If this threshold is ever approached, Cloud Run will spin up a new instance to the service.
If you’ve already met your maximum instances or if there’s a resource availability issue (or something similar), you might find that the CPU utilization threshold surpasses 60% and doesn’t come down. This is something to get alerted about, because that means that you can quickly check the logs to see what the issue is and perhaps increase the maximum instances configured for your Cloud Run service.
Click to create a new alerting policy.
To create the metric, look for Container CPU Utilization in the list of available metrics. Choose it and click Apply.
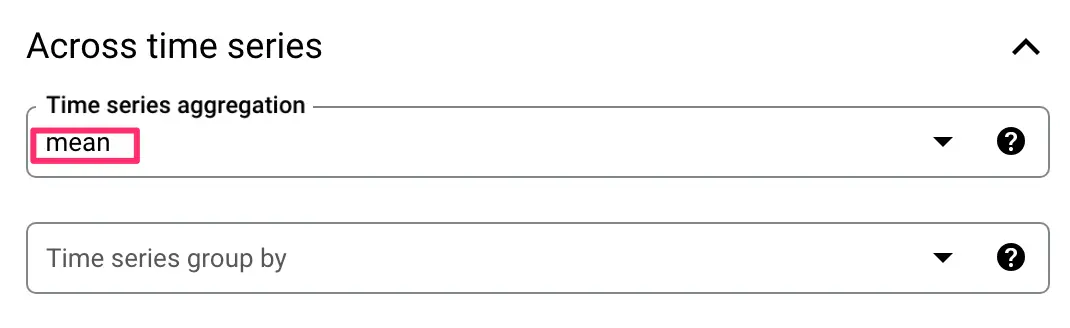
You can keep the Rolling window at 5 minutes, and we’ll keep our focus on the 99th percentile.
This time, however, choose mean as the Time series aggregation method. This will flatten the data from all of the Cloud Run revisions collecting traffic, and it will focus on the mean utilization rate. In other words, the average utilization rate across all of your Cloud Run services is being monitored here.
In the trigger configuration, set 60 as the threshold value. This way you’ll be notified if the average CPU utilization across your Cloud Run services stays above 60% for a time period of 5 minutes.
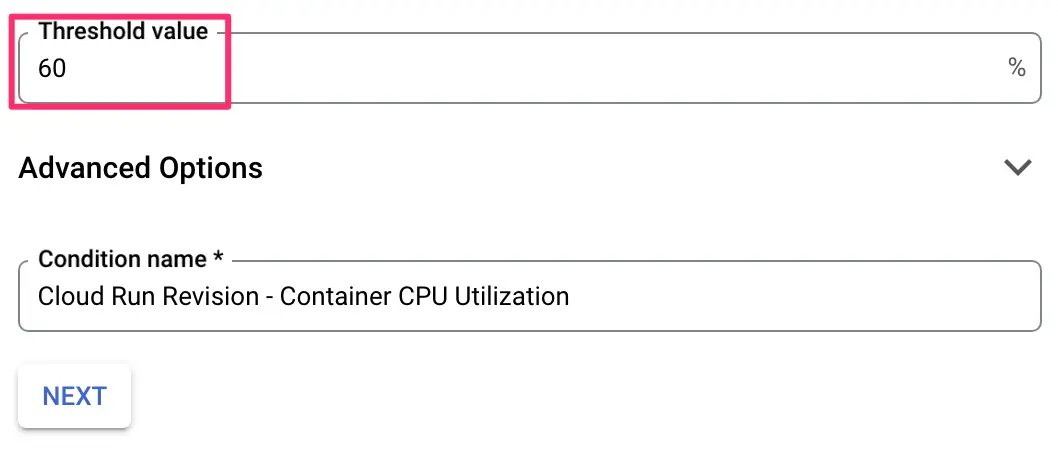
Then, choose the notification channels, give the alert policy a name, and click SAVE POLICY to save the alert.
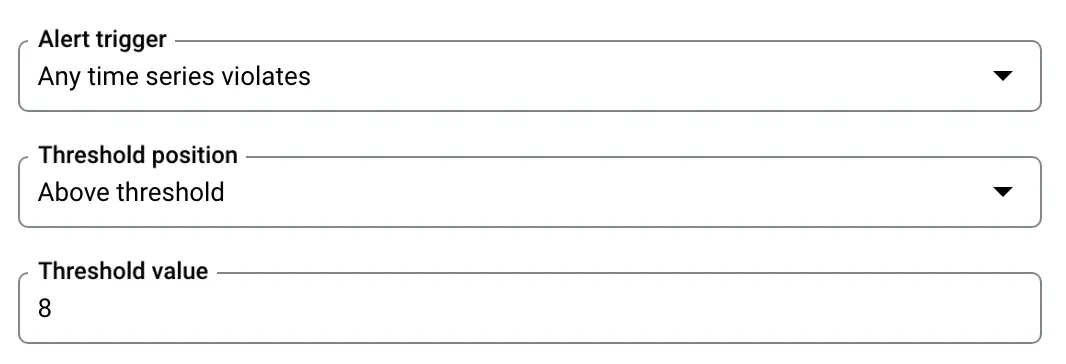
Alert 3: Instance count
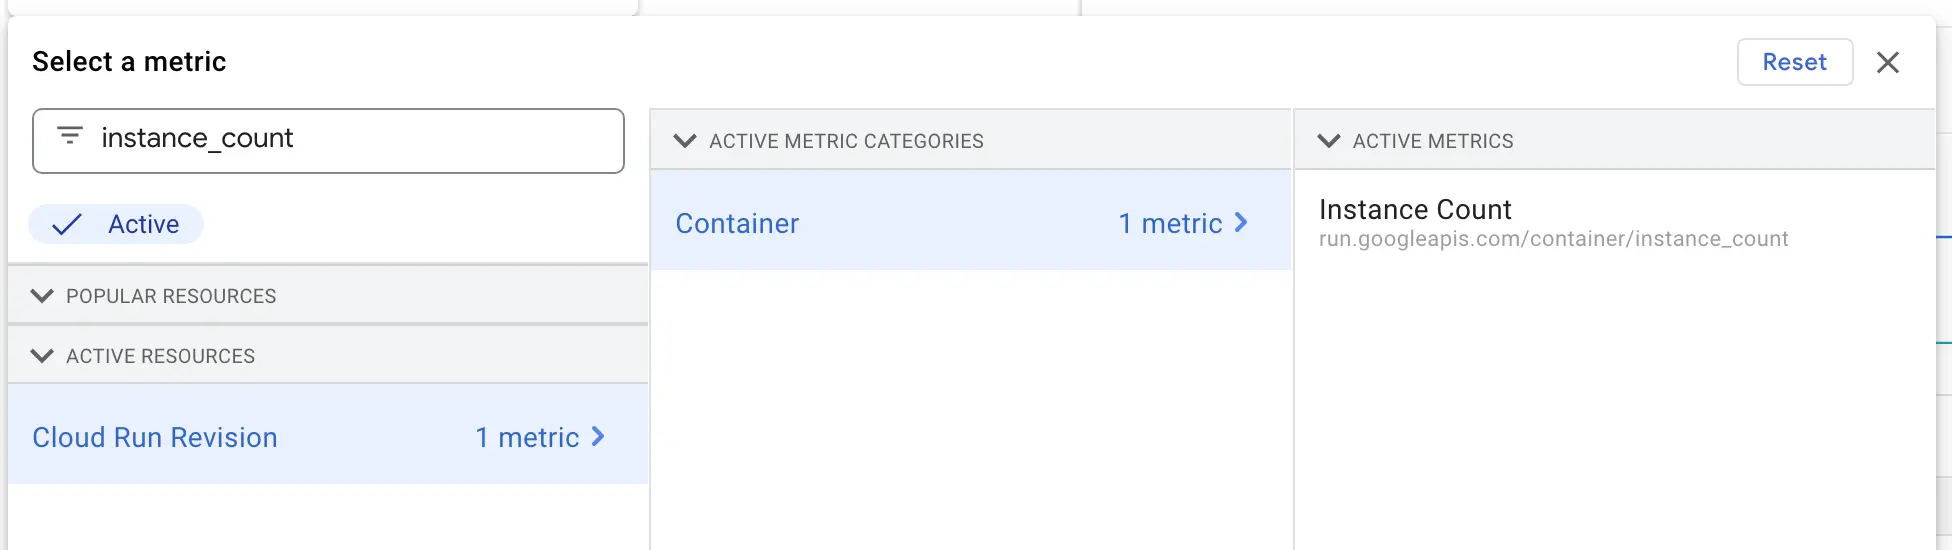
Our third alert will monitor the average count of instances for each Cloud Run service. If you’ve followed the recommended settings, your server-side tagging services should have a maximum instance count of 10. If the auto-scaler ever hits, let’s say, 80% of that (or 8), you might want to quickly deploy a new revision of your service with a higher maximum instance count to prevent outages.
After clicking to create a new alert, search for instance_count in the metric selector. Choose the Cloud Run instance count and click Apply.
Again, let’s go with the 5-minute rolling window. Choose mean as the rolling window function. This way we’ll get alerted if the average instance count over a 5-minute window was ever over the threshold.
In the trigger settings, make sure the trigger applies to any time series violation (so any Cloud Run service might trigger it), and set the threshold value to 8. Remember to adjust this to be roughly 80% of whatever your Cloud Run services’ maximum instances are configured to be.
Finally, configure the notifications, give the policy a name, and click SAVE POLICY.
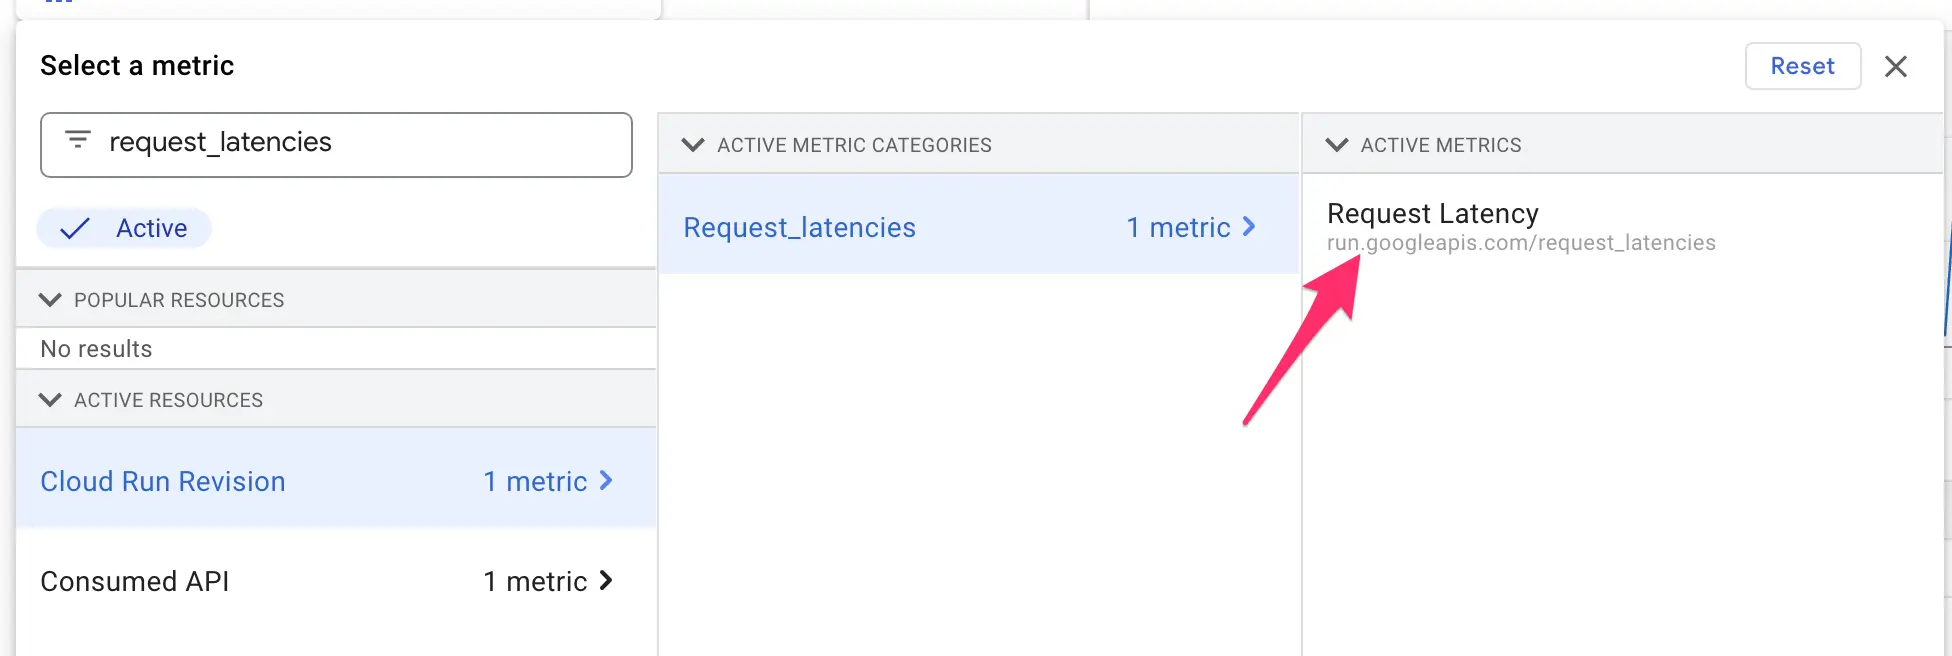
Alert 4: Request latency
The last alert we’ll create monitors average request latency. Latency is the time it takes to produce a response to any given request. If you experience abnormal latency peaks, it usually means that something is overwhelming your services and you might need to adjust the number of available instances, for example.
Click to create a new policy, and then search for request_latencies. Make sure you select the metric for Cloud Run Revision. Click Apply when you find it.
Again, we’ll look at a 5-minute rolling window for the 99th percentile of requests.
Choose mean as the Time Series aggregation method. We want to look at the average request latency across all our Cloud Run services.
For the trigger threshold value, I’ve chosen 2000 milliseconds. This means that if the average request latency across my Cloud Run services is over 2 seconds for a time period of 5 minutes, I will get alerted.
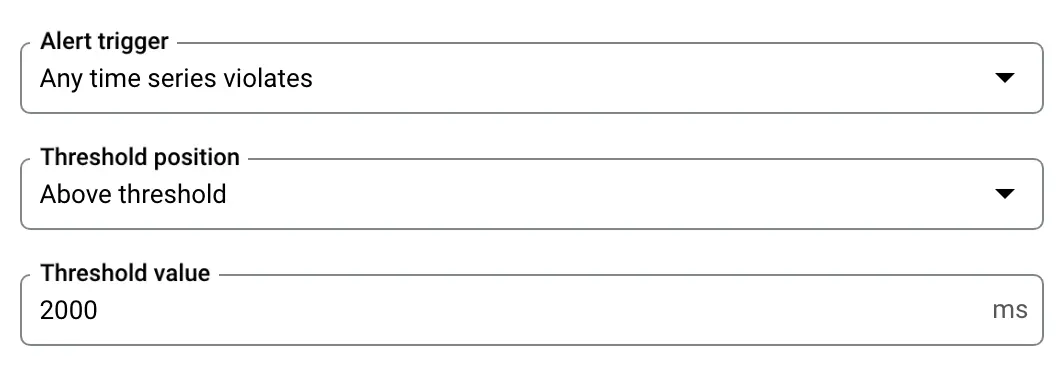
Configure the rest of the settings as before, and click SAVE POLICY when done.
All done!
Let’s review what you’ve created here:
- A Startup Probe health check for your Cloud Run services to monitor if the services started up right.
- A Liveness Probe health check for your Cloud Run services to continuously monitor whether the services are up and running.
- A Budget and Billing alerts to notify you in case you are approaching a predetermined cost limit for running server-side GTM.
- A monitoring policy that alerts you in case you receive HTTP error messages at a rate of 5/s over a time window of 5 minutes.
- A monitoring policy that alerts you in case the average CPU utilization threshold across your Cloud Run services surpasses 60% over a time window of 5 minutes.
- A monitoring policy that alerts you in case the average instance count for any one of your Cloud Services surpasses 8 over a time window of 5 minutes.
- A monitoring policy that alerts you in case the average request latency across your Cloud Services surpasses 2 seconds over a time window of 5 minutes.
Just remember that these are rough examples you can try if you wish, but you should quickly get into the habit of tweaking them to work with your particular setup.
The purpose of monitoring like this is to help you prepare for cases where your server-side setup is on the verge of becoming unresponsive. You can also play with the new Forecasted metric-value alerting policies that are currently open for testing. They should give you even more buffer to act before it’s too late.
Regardless of your approach, if you are running server-side Google Tag Manager in a cloud environment that you control, you will need to set up some type of monitoring in place. At the very least, make sure you have those billing budgets set. There’s nothing as demoralizing than a huge, unexpected credit card bill.
Please let me know in the comments if you have other go-to policies you like to configure for your Cloud Run services!
Thank you to fellow members of Measure Slack for a lively discussion about monitoring options. Giovani Barbosa, Taneli Salonen, Christiaan Dollen, and others gave some great ideas of a basic set of measurements.

3 Responses
However, if we use an external DNS based address like ‘https://gtm.yourwebsite.com/healthy’ – the traffic is going through the (external global) application load balancer, and then can be routed to some region, but not to others, in case we have cloud runs services deployed in more than one region.
A warning for anyone having their GTM Server CloudRun service behind a firewall with direct external traffic to the service blocked:
The Liveness Probe has to be configured with the complete URL address (ex: gtm.yourwebsite.com/healthy) not just the URL path (/healthy) as described in the blog post. If you configure just a path, the Liveness Probe is going to try to reach yourcloudrunservice.region.run.app/healthy and will fail, which will automatically kill the instances in your revision and replace them.
Good tip, thanks!